
Risk matrix
You can use risk matrices in the Portal to see how many risks have been assessed and how they have been rated. The different colors in the risk matrix indicate the severity of the impact and the occurrence probability. On homepages and in dashboards, you can create and configure custom risk matrices within diagram boxes. You can use the Theme editor to assign a color for each area of the 4x4 matrix. Your custom coloring is then applied to all risk matrices in the Portal.
Note: Risk matrices always comprise four rows and four columns.
Example configuration in a tab view
In the following example, you configure a gross and net risk matrix that is displayed on processes in an additional tab view in a diagram box.
Instructions:
-
Open the SystemAdministration
-
Open the Portal report
-
Create a new Dashboard via the context menu of the Tab views and assign the name Risks:

-
Reference the Process category in the Visible attribute of the new dashboard:
-
Create a new Diagram box via the context menu of the dashboard and assign the name Risk assessment:

-
Activate the Display diagrams side by side option in the properties of the diagram box:

-
Create a Diagram via the context menu of the diagram box and assign the name Risk matrix - GROSS:

-
Create another Diagram via the context menu of the diagram box and assign the name Risk matrix - NET
-
Configure the two risk matrices as follows:
Property Risk matrix - GROSS Risk matrix - NETTO Source Create a Category query and reference the Risk category under the Categories.
Note: You can set any risk category here.
Create a Category query and reference the Risk category under the Categories.
Note: You can set any risk category here.
Diagram Select the Risk matrix diagram type here. Select the Risk matrix diagram type here. Value(s) Reference the schema attributes Occurrence probability (gross) and Damage potential / amount (gross).
Requirements: The referenced values must be contained in the source.
Note: Reference attributes from which the risk class is determined. As a rule, these are the probability of occurrence and the impact or categories derived from these.
Reference the schema attributes Occurrence probability (net) and Damage potential / amount (net). Requirements: The referenced values must be contained in the source.
Note: Reference attributes from which the risk class is determined. As a rule, these are the probability of occurrence and the impact or categories derived from these.
Show X-Axis label Enable this option. Enable this option. Custom X-axis label Enter the name Occurrence probability (gross). The label is then displayed as the X-axis label in the risk matrix. Enter the name Occurrence probability (net). The label is then displayed as the X-axis label in the risk matrix. Show Y-Axis label Enable this option. Enable this option. Custom Y-axis label Enter the label Impact (gross). The label is then displayed as a Y-axis label in the risk matrix. Enter the label Impact (net). The label is then displayed as a Y-axis label in the risk matrix. -
Save in the dialog and via the toolbar of the SystemAdministration
-
Open the Theme editor in the Portal
-
Switch to the Diagrams area
-
In the Risk matrix colors column, click a tile from the 4x4 matrix to adjust the color using the editor:

-
Close the Theme editor
Results:
-
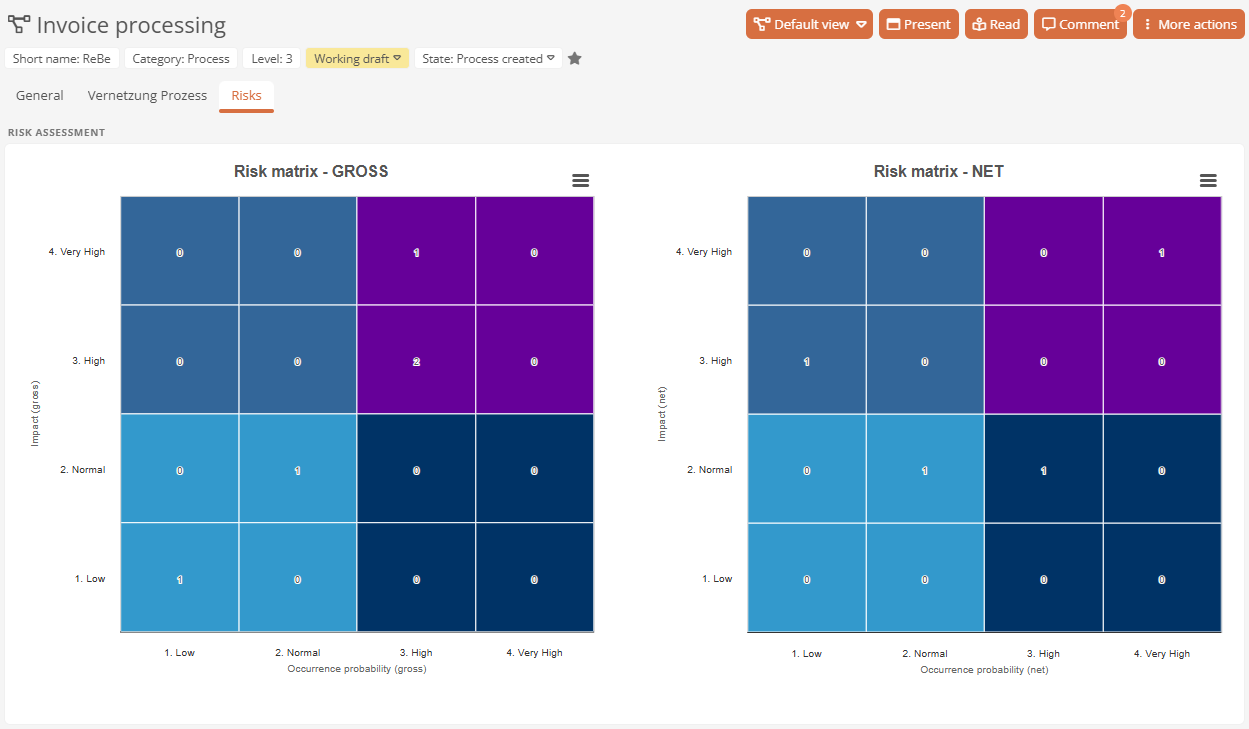
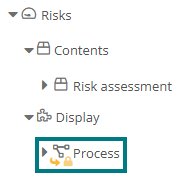
Additional tab view: The two risk matrices are displayed in the Portal on processes in an additional tab view within a diagram box next to each other.
-
Custom coloring: The corresponding coloring from the Theme editor is used for the individual tiles of the 4x4 risk matrix.
-
Meaningful labeling: The tab view, the diagram box and the risk matrices are each displayed with a title. The configured labeling of the X and Y axes is visible in the risk matrices. The levels of impact and occurrence probability are displayed in columns and rows with their label and in the order that is stored by default in the General master data of the Model overview.
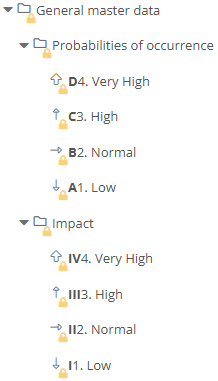
Note: The order of the rows and columns is based on the alphanumeric characters in the shortname of the respective level.
-
Classification information: The number in an area shows you how many risks have been rated with the corresponding classification. If you hover over a tile, the classification of the impact and occurrence probability is displayed in a tooltip.

-
Retrievable details: If you click on a tile where no 0 is displayed, the objects that have been assigned the corresponding classification are listed in the dialog. Click on an object to open the sidebar with the object properties. If you double-click on the object, you can navigate directly to the object.

 Related Topics